The bottom line: if you can't measure it, you can't optimize it. These dashboard templates give you the exact metrics you need to track both dollars and CO₂ - without drowning in data. We provide three distinct dashboard types to cater to different needs within your organization.
Coming Soon
These dashboard designs represent what I think GreenOps dashboards should look like. The actual templates and implementation code will be shared in the future. For now, use these conceptual designs to plan your GreenOps reporting strategy.
Executive GreenOps Overview
Perfect for monthly leadership reviews and board presentations, providing a high-level snapshot of GreenOps performance.
This dashboard offers a bird's-eye view of your organization's GreenOps posture. It focuses on key performance indicators (KPIs) that matter most to leadership, highlighting trends, target achievement, and critical alerts.
Key Metrics Panel
The dashboard prominently displays top-line numbers and their trends compared to the previous month:
monthly_metrics:
 total_spend:"$47,200"
 total_emissions:"12.4 tons CO₂e"
 efficiency_ratio:"262 kg CO₂e/$1K"
 renewable_percentage:"73%"

trends: # vs. Previous Month
 cost_change:"-18% ↓" # Green if negative
 carbon_change:"-23% ↓" # Green if negative
 efficiency_change:"-6% ↓" # Green if negative
 renewable_change:"+12% ↑" # Green if positive
Alert Tiles
Configurable alerts to flag critical issues requiring attention:
alerts:
 cost_spike:
 condition:"monthly_increase > 20%"
 message:"Cost spike detected in us-east-1"
 action:"Review auto-scaling policies"

 carbon_efficiency:
 condition:"kg_co2e_per_dollar > threshold"
 message:"Carbon efficiency declining"
 action:"Check for idle resources"

 renewable_target:
 condition:"renewable_pct < 80%"
 message:"Renewable energy below target"
 action:"Consider region migration"
Executive Action Items
A summary of recent wins and upcoming targets to drive continuous improvement:
THIS MONTH'S WINS
- Saved $8.6K by rightsizing production instances
- Reduced carbon 23% through ARM migration
- Achieved 73% renewable energy usage
NEXT MONTH'S TARGETS
- □ Migrate batch jobs to us-west-1 (90% renewable)
- □ Implement auto-shutdown for dev environments
- □ Target: <250 kg CO₂e/$1K efficiency ratio
Chef's Tip for Executives
Focus on the trends and efficiency ratios. A declining kg CO₂e/$1K is a strong indicator of successful GreenOps initiatives. Use the action items to drive accountability.Operations GreenOps Dashboard
Daily dashboard for DevOps teams and platform engineers to monitor and optimize in real-time.
This dashboard is designed for the teams on the ground. It provides real-time metrics and actionable insights to help engineers make daily optimization decisions.
Real-Time Metrics
Key operational metrics updated frequently (e.g., every 15 minutes):
current_state:
 active_instances: 247
 idle_instances: 23 # Red if > 10
 carbon_intensity:"420 gCO₂/kWh" # Current grid intensity
 optimal_regions:
 -"us-west-1: 180 gCO₂/kWh"
 -"eu-north-1: 98 gCO₂/kWh"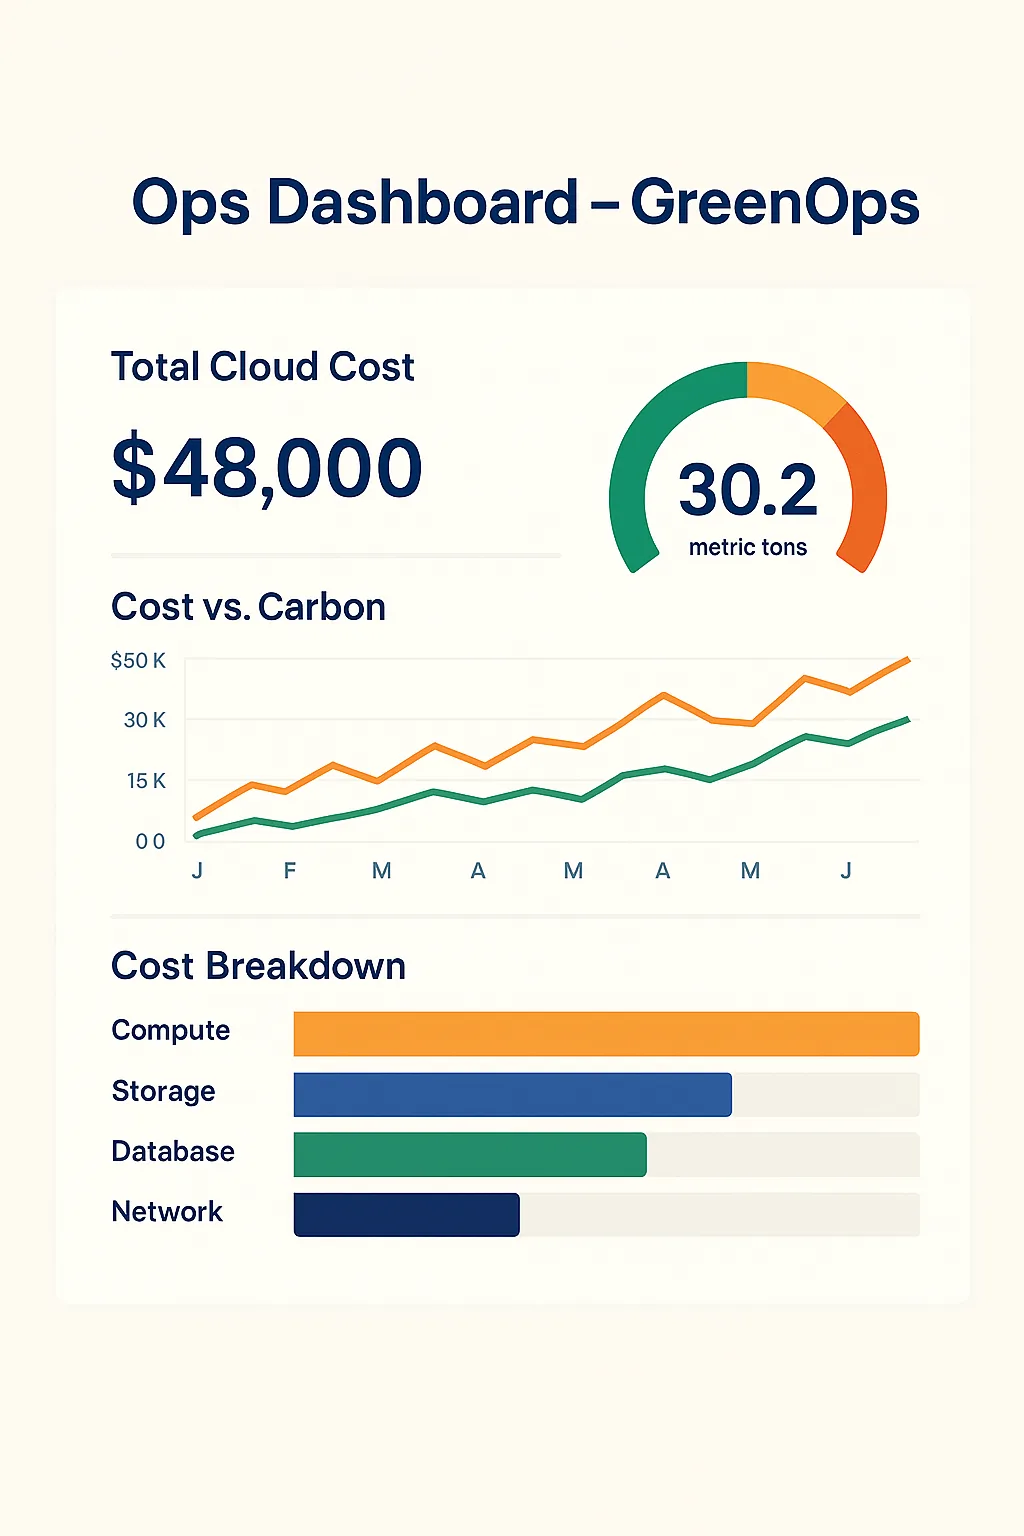
Service-Level Breakdown
Top services by carbon impact, showing cost, emissions, efficiency, and trend:
services:
 api_production:
 cost:"$12,400"
 emissions:"3.2 tons CO₂e"
 efficiency:"258 kg/$1K"
 trend:"improving"

 ml_training:
 cost:"$8,900"
 emissions:"4.1 tons CO₂e"
 efficiency:"461 kg/$1K"
 trend:"stable"

 data_pipeline:
 cost:"$6,200"
 emissions:"1.8 tons CO₂e"
 efficiency:"290 kg/$1K"
 trend:"degrading"
Action Queue
Prioritized list of actions for the operations team:
HIGH PRIORITY (Fix Today)
- □ Shutdown 23 idle dev instances (Save: $106/day + 4kg CO₂e)
- □ Delete 47 unattached volumes (Save: $31/day + 0.5kg CO₂e)
- □ Rightsize ml-training-cluster (Save: $78/day + 12kg CO₂e)
MEDIUM PRIORITY (This Week)
- □ Migrate batch-processor to us-west-1 (Save: $45/day + 18kg CO₂e)
- □ Update auto-scaling policies for api-prod (Save: $34/day + 6kg CO₂e)
- □ Archive old data to cold storage (Save: $28/day + 3kg CO₂e)
Operational Focus
The Operations Dashboard should empower engineers to quickly identify and act on inefficiencies. Integrate with alerting systems for proactive notifications.Deep Dive Analytics Dashboard
For advanced teams performing sophisticated carbon optimization and predictive analysis.
This dashboard caters to data analysts, sustainability specialists, and FinOps architects who need to perform in-depth investigations and strategic planning.
Carbon Attribution Matrix
Multi-dimensional analysis of carbon emissions by service, region, and time:
attribution:
 by_service:
 - name:"api-production"
 cost: 12400
 carbon: 3200 # in kg CO2e
 utilization: 0.67
 region:"us-east-1"
 by_region:
 - name:"us-east-1"
 carbon_intensity: 420 # gCO2/kWh
 renewable_pct: 45
 workloads: ["api","db","cache"]
 by_time:
 peak_hours:"9AM-5PM EST"
 carbon_delta:"+35% vs off-peak"
 cost_delta:"+12% vs off-peak"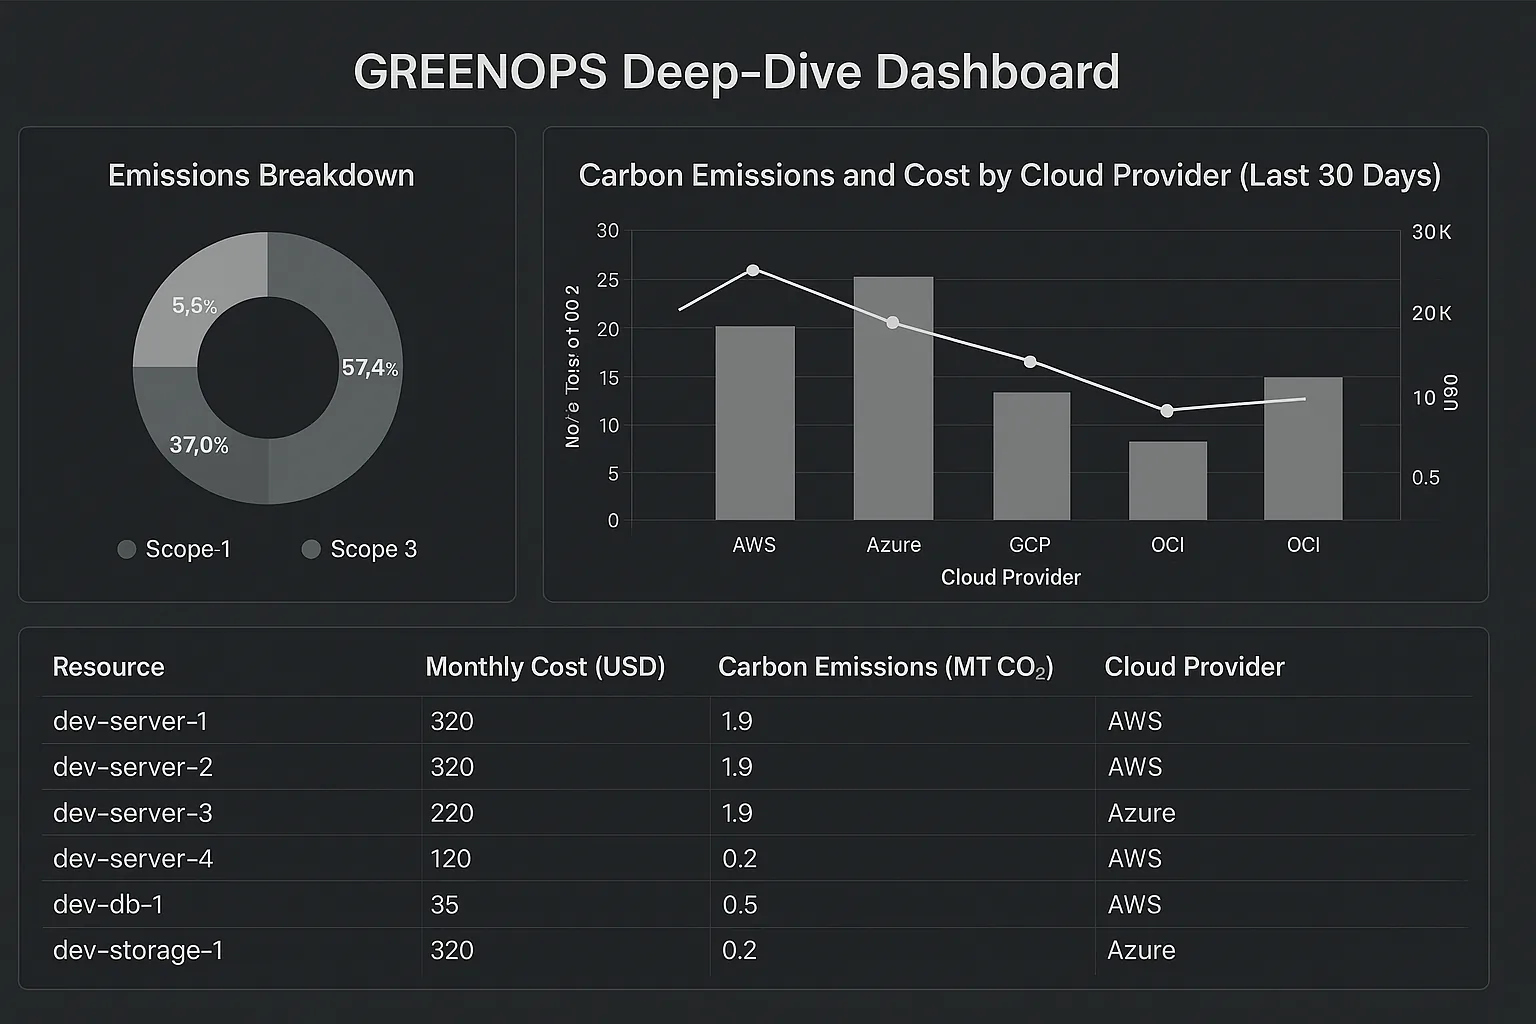
Predictive Analytics & ROI
Forecasts for cost and carbon, along with an ROI calculator for optimization projects:
predictions:
 cost_forecast:
 current_trend:"$47.2K → $52.1K"
 with_optimization:"$47.2K → $34.8K"
 confidence:"87%"
 carbon_forecast:
 current_trend:"12.4 → 13.8 tons CO₂e"
 with_optimization:"12.4 → 8.7 tons CO₂e"
 confidence:"82%"

# ROI Calculator Example
roi_calculator:
 investment_required:
 engineering_time_cost: 6000 # 40hrs * $150/hr
 tool_licenses_yearly: 2400
 total_investment: 8400
 monthly_returns:
 cost_savings: 12400
 carbon_value: 186 # 3.1 tons * $60/ton (example social cost)
 total_monthly_return: 12586
 roi_metrics:
 payback_period_days: 20
 annual_roi_percentage: 1790
 npv_3_year: 445692
Data Complexity
The Deep Dive Analytics dashboard requires robust data pipelines and potentially custom application development. Start with simpler dashboards if your data maturity is still developing.Implementation Guides
Practical steps and code snippets to set up your GreenOps dashboards.
Setting up these dashboards involves connecting to various data sources, writing queries, and configuring visualization tools. Below are high-level guides for each dashboard type.
Executive Dashboard Setup (Power BI/Grafana)
Data Sources Required:
- Cost Data: AWS Cost Explorer API, Azure Consumption API, GCP Billing Export
- Carbon Data: AWS Customer Carbon Footprint, Azure Emissions Impact Dashboard, GCP Carbon Footprint
- External Data: ElectricityMap API (grid carbon intensity), EIA.gov (renewable energy percentages)
SELECT
 DATE_TRUNC('month', usage_date) as month,
 SUM(cost_usd) as total_cost,
 SUM(carbon_kg_co2e) as total_carbon,
 (SUM(carbon_kg_co2e) / SUM(cost_usd) * 1000) as kg_co2e_per_1k_usd
FROM cloud_usage
WHERE usage_date >= DATE_SUB(CURRENT_DATE(), INTERVAL 6 MONTH)
GROUP BY 1
ORDER BY 1;
Implementation Timeline
The actual dashboard templates, data connectors, and implementation scripts will be shared in the future. These conceptual designs provide a starting point for planning your GreenOps reporting strategy.
Getting Started Checklist
Your recipe for successfully launching GreenOps dashboards.
- Identify Key Stakeholders: Who needs which dashboard?
- Define Core Metrics: What are your GreenOps KPIs?
- Assess Data Sources: Can you access cost, usage, and carbon data?
- Choose Visualization Tools: Power BI, Grafana, CloudWatch, Azure Monitor, or custom?
- Start Small: Implement one dashboard (e.g., Executive Overview) first.
- Iterate & Refine: Gather feedback and continuously improve your dashboards.
- Automate Data Collection: Set up pipelines for regular data ingestion.
- Train Your Teams: Ensure everyone knows how to use and interpret the dashboards.
Ready to Cook Up Some GreenOps Insights?
Stay tuned for our upcoming dashboard templates and implementation guides. In the meantime, start planning your GreenOps metrics strategy.
What to do next
Pick the path that fits where you are right now.